A Free Biodiversity Report for Any Queensland Property
Live since 25 September 2026
biodiversitychecker.au is free, covers all of Queensland, and needs nothing but an address.
Type a Queensland address into biodiversitychecker.au and a few seconds later you get a free report on what the State’s mapping says is on and around that property: koala habitat, the regional ecosystems, threatened animals and plants, declared weeds recorded nearby, waterways and wetlands, and whether the block sits inside a fire ant biosecurity zone. There is no login to create and nothing to pay.
It was built by seven students at Peachester State School for their FIRST LEGO League project, and Queensland Ecologists donated the time and the technology behind it. Most Queensland landowners have never seen their own place described this way. We spend a fair part of our working life telling people what is mapped across their land, and it is usually at the point where finding out has become expensive.
Report count read from the live counter on 29 September 2026, and it has kept climbing since.
What a report actually gives you
The report opens with the property drawn over aerial imagery and an interactive map you can pan around, then works through what is mapped there. Each section is written for someone who has never read a planning instrument, with the photos of the species that have been recorded nearby, because a list of scientific names tells an ordinary person nothing.
The report page
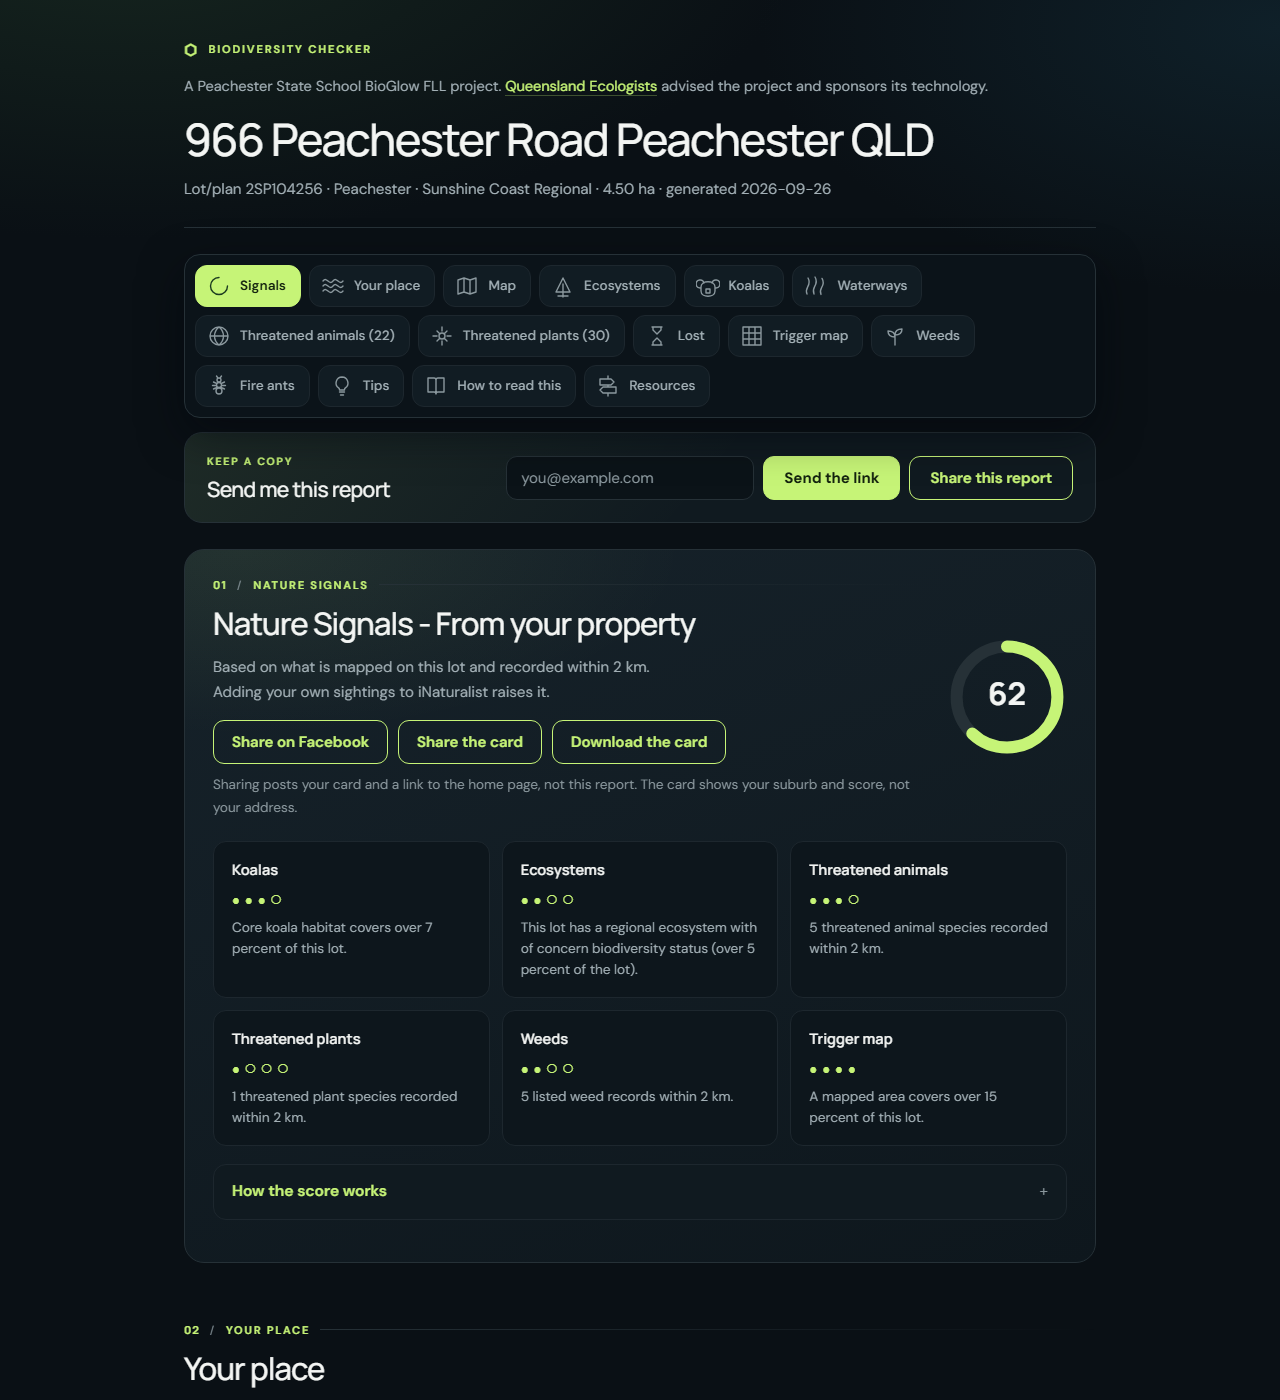
The team ran their own school grounds at Peachester, 4.5 hectares, and published it as the worked example. The contents bar counts what was found in each section.
| Section | What it answers |
|---|---|
| Nature Signals | Six graded tiles giving the property a score, each one clickable through to the section it grades |
| Explore the map | The lot boundary against aerial, koala mapping, waterways and nearby wildlife sightings |
| Ecosystems | The regional ecosystems mapped on and around the block, with their biodiversity status |
| Koalas | Whether the land is mapped koala habitat or sits in a priority area, and what that means before clearing |
| Threatened species | Animals and plants recorded nearby, sorted most threatened first, with photos |
| Weeds | Declared and invasive species with records near the property, and how to report them to your council |
| Waterways and wetlands | Mapped watercourses and wetland values across the property |
| Fire ants | Whether the block falls inside a biosecurity zone |
There is also a “lost biodiversity” section listing species recorded in the area that are now extinct, a directory of the agencies and groups that can help, and the nearest Landcare group to the property. The whole thing ends with practical suggestions: what to plant, who to call locally, and what to look for in the months when it is easiest to find.
Why Queensland Ecologists put its technology behind it
We have spent the last few years building the mapping and data analytics side of this business properly: automated constraints mapping that pulls from dozens of State and Commonwealth spatial services, geospatial analysis that measures each overlay against the actual lot geometry and reports the area it covers, and a reporting engine that turns all of it into something a client can act on. The engine behind biodiversitychecker.au is a version of the one we use for paid ecological constraints reports, rebuilt and stripped back for a public audience.
That investment has kept going, and some of it now runs on AI and computer vision, reading imagery and flagging what deserves a human look. We are equally deliberate about the places it stays out of, which is why the reports on this particular site are written from templates. Thermal imaging is the newest of these services and it is available now: thermal survey work picks up warm-bodied animals at night and in dense canopy where a spotlight and a pair of eyes will walk straight past them, which matters for nocturnal fauna, for gliders, and for pre-clearance checks where missing an animal is the whole risk. If that is relevant to a site you are working on, it sits alongside our fauna surveys.
Giving a school team the good version of that toolkit cost us some weekends and nothing else. They did the hard part, which was deciding what an ordinary person actually wants to know about their own backyard, and then arguing about it until the answer was clear enough for a ten year old to use.
The leaderboards
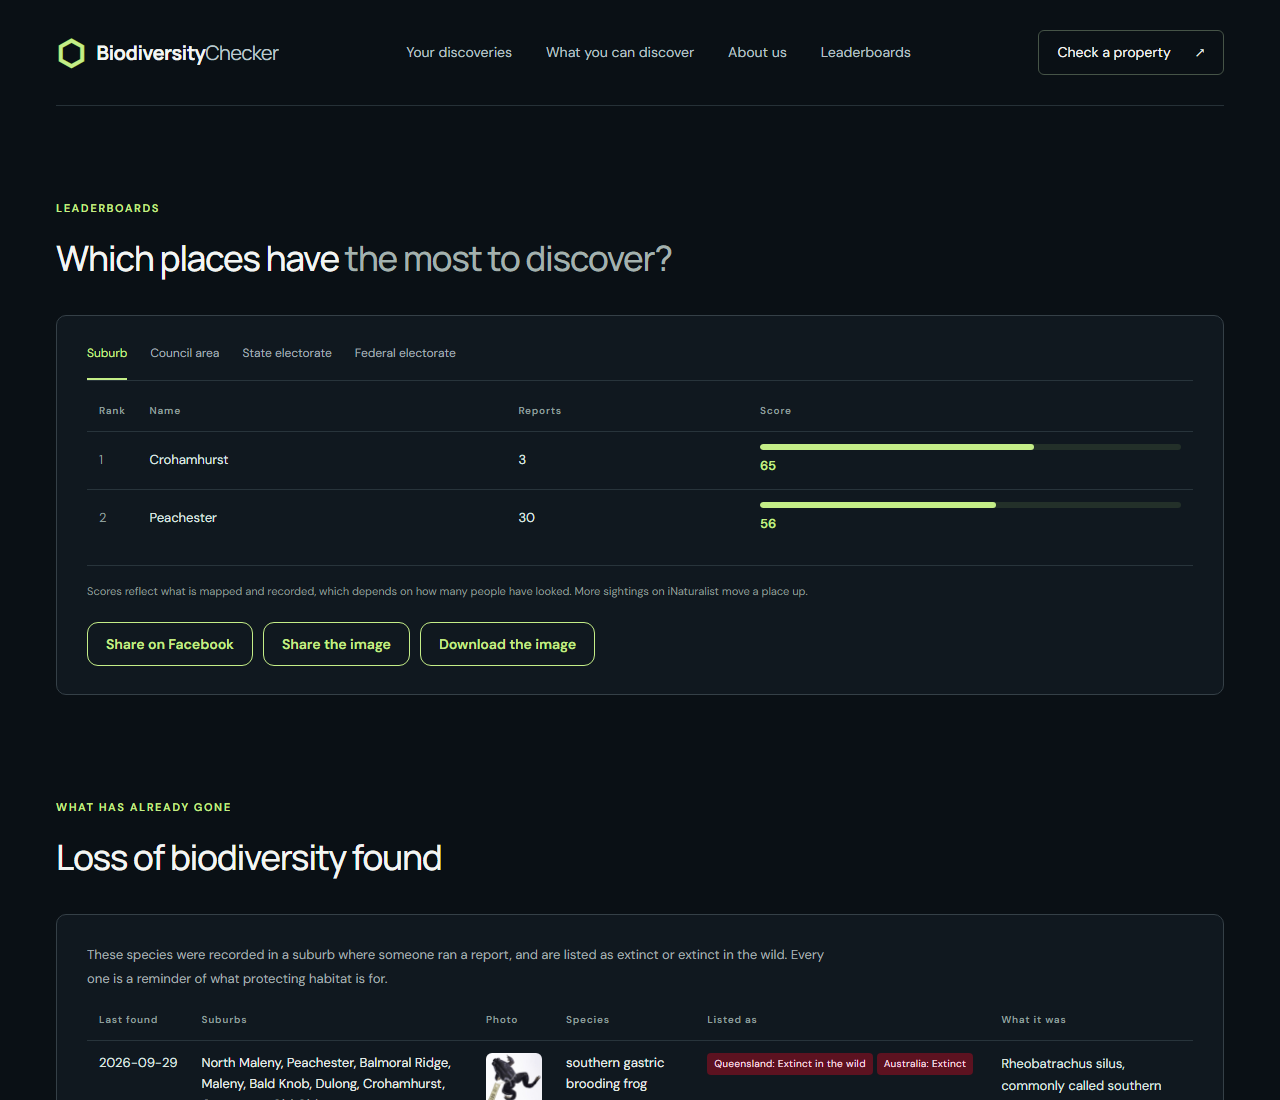
The leaderboards rank suburbs by what their reports have found. A suburb needs three reports before it appears, and no address is ever published.
What the checker does not do
We insisted on this section before any of it went live. The report is a discovery tool built from public mapping. It is not an ecological assessment and it will not satisfy a council, a condition or a State agency.
If a report raises something that touches a development, a clearing proposal or a purchase, that is the point to talk to an ecologist. Our ecological constraints analysis is the paid equivalent, done properly: every relevant State and Commonwealth layer, measured against your actual lot boundary, with the findings assessed against what you are trying to do. Where a report flags protected plants or threatened species, the next steps are usually a flora and vegetation survey or a targeted threatened species survey.
Try it on your own place
Go to biodiversitychecker.au and enter an address or a lot on plan. The report usually builds in well under a minute.
These are the two that most often surprise people who thought their block was unremarkable.
Plant something native, report a weed to your council, or call us if it touches a project.
The front page
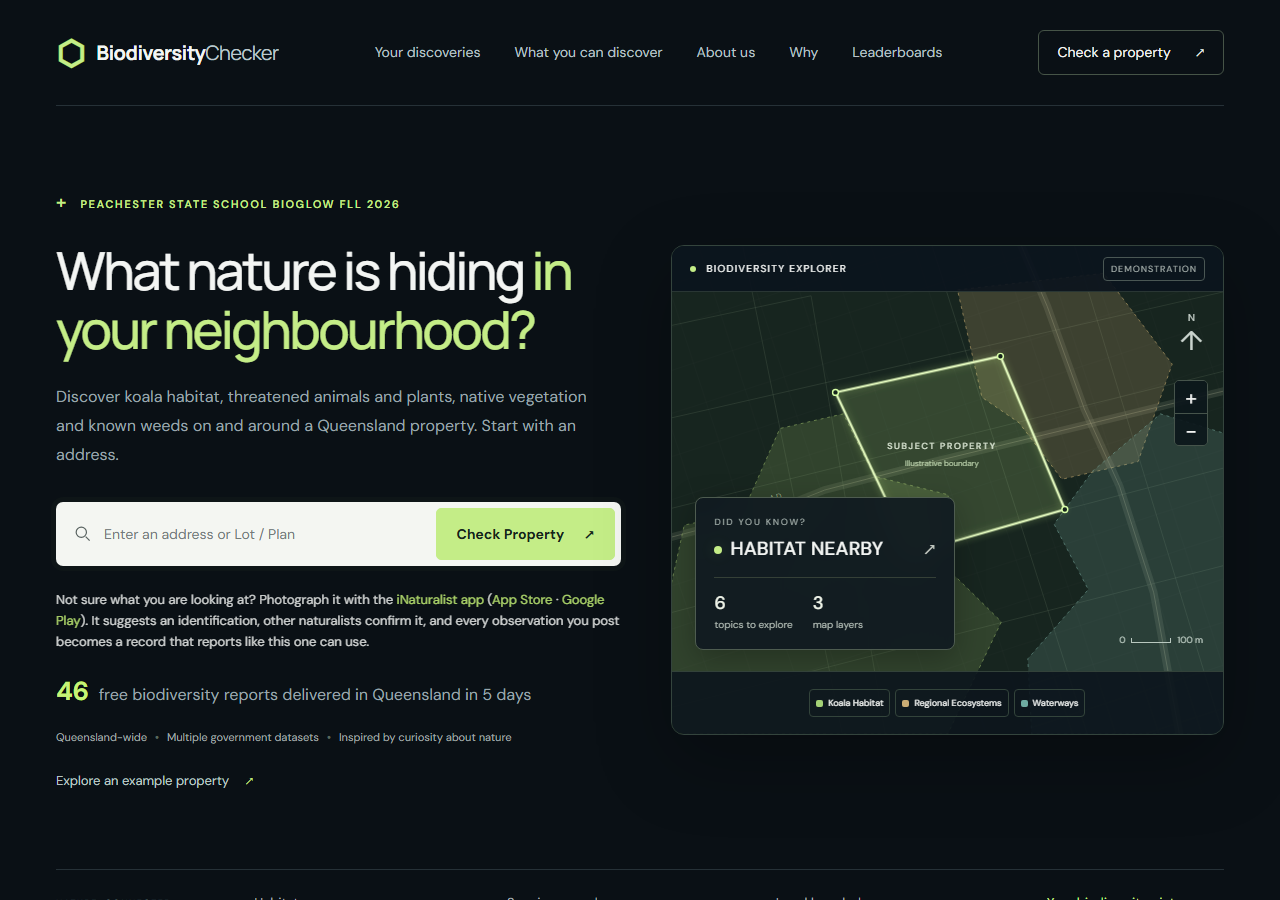
One search box, and a worked example if you would rather look before you type your own address in.
Questions people have asked
Is it really free, and what happens to my address?
Free, with no account and no payment. The address is used to find the lot and is not published anywhere. The shareable summary card deliberately says “a property in” the suburb rather than naming the street, so someone can post their result without broadcasting where they live.
Where does the data come from?
Queensland Government spatial services for the mapping, which is the same source we use in paid work: vegetation management mapping, koala habitat mapping, the protected plants trigger map, watercourse and wetland mapping, and biosecurity zones. Species records come from government wildlife data alongside the Atlas of Living Australia and iNaturalist. Photos are free-licensed images from iNaturalist, the Atlas of Living Australia and Wikimedia Commons, each credited to the photographer.
Can I use it for a development application?
No. It reports what is mapped, which is a starting point rather than an assessment. A council or a State agency asking for ecological information is asking for work done by a suitably qualified person against the relevant codes, based on someone attending the site.
The report says something is on my land and I do not think it is there
That happens, and it cuts both ways. Broad-scale mapping misses things and it also maps things that are no longer present. Where the difference matters, for a clearing proposal or a purchase, it is resolved by someone walking the ground and, where the mapping itself is wrong, through the State process for correcting it.
How can a school team build this?
FIRST LEGO League asks teams to identify a real problem and design a solution, and this was theirs. They had the engine donated, so the work went into deciding what a report should say, which species to show, how to word something so a person who is not an ecologist can act on it, and what to leave out. Anyone who has tried to explain regional ecosystems to a stranger will recognise how much of the project that was.
Constraints on a site you are working on?
If something the checker raised touches a development, a clearing proposal or a purchase, we do the assessed version: every relevant layer measured against your lot, with thermal fauna survey now available where nocturnal species are in play.
Request a quote or call 07 3018 7538.